For activities, the transaction is /HSEA/SEAzam_MONITOR.
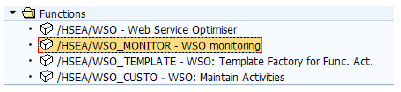
- You can find it in your user menu in :

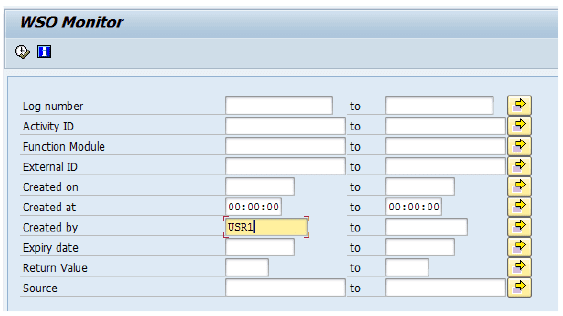
- When you start the monitoring, different fields are available to filter the log :
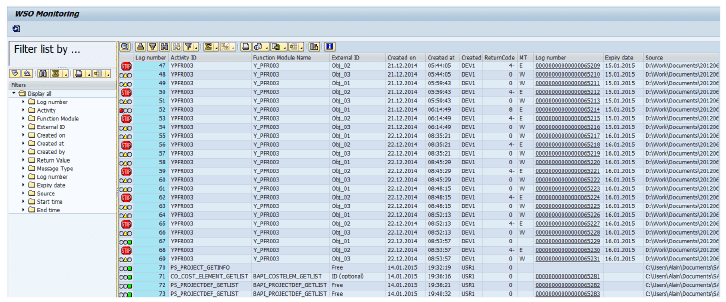
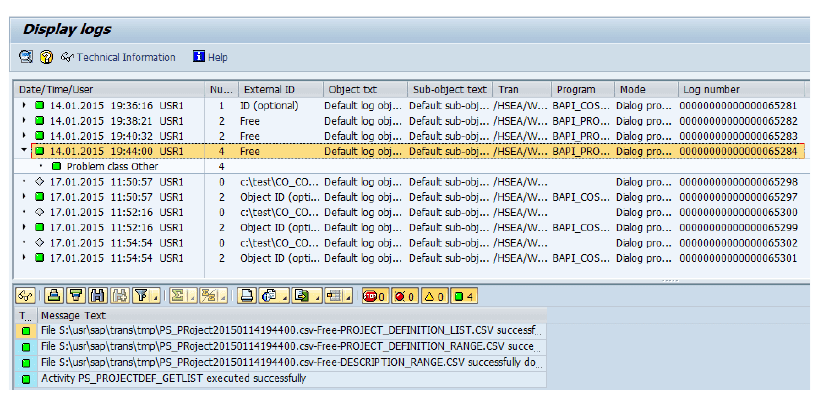
- On the left, you can see a list of folder that helps to sort the logs. Icons help to identify the status of the activities. If you double click on a line you open the detail screen.
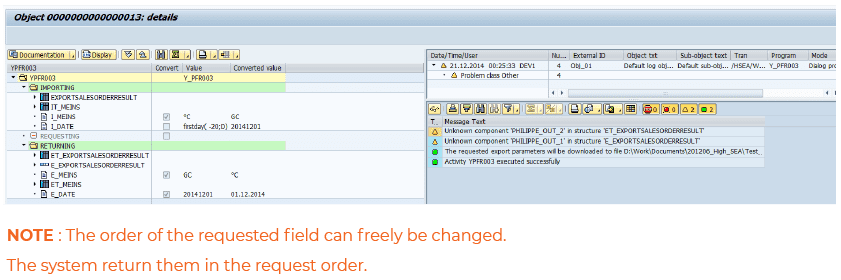
- On the left, you can see the details of the operation. On the right, you can see the different messages.
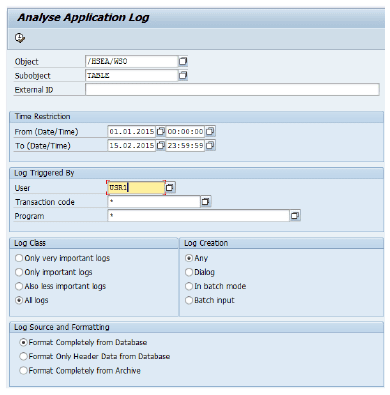 Depending on the log objects and subobjects you selected, it’s possible to filter on different fields to verify the log of the activities.
Default object value :/HSEA/SEAzam
Default subobject :
– Activities : DEF
AULT
– Table ID’s : TABLE
You can create your own object with transaction SLG0.
- When you double click on a line, you can see the details. Details of the log are different for a table ID or an activity but the some info is also depending from the Application system of the SAP server.
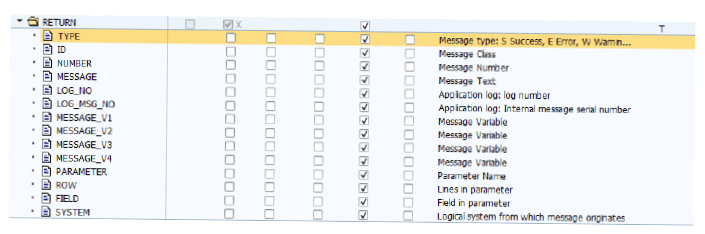
To export the log for activities, flag the fields in the “RETURN” directory at the template creation.
Here below the available fields :